Case study. R / Shiny.
Software Cost Estimator
COCOMO II cost estimation for any software project, with test-locked math
- Role
- Solo: estimation engine, Shiny app, PDF pipeline, test suite
- Status
- Livev2.2.0MIT
- Context
- 2026, personal
- Test assertions
- 440
- Weighted languages, plus any other
- 21
- Cost cliff eliminated
- 42%
- Honest estimate range
- ±30%
v2.2.0, October 2026; 9 files: engine, helpers, plan advisor, UI contracts, PDF render
Unlisted languages count at 1.0; the scanner detects them too
Cost cliffs removed in the v2.0 model audit
The problem
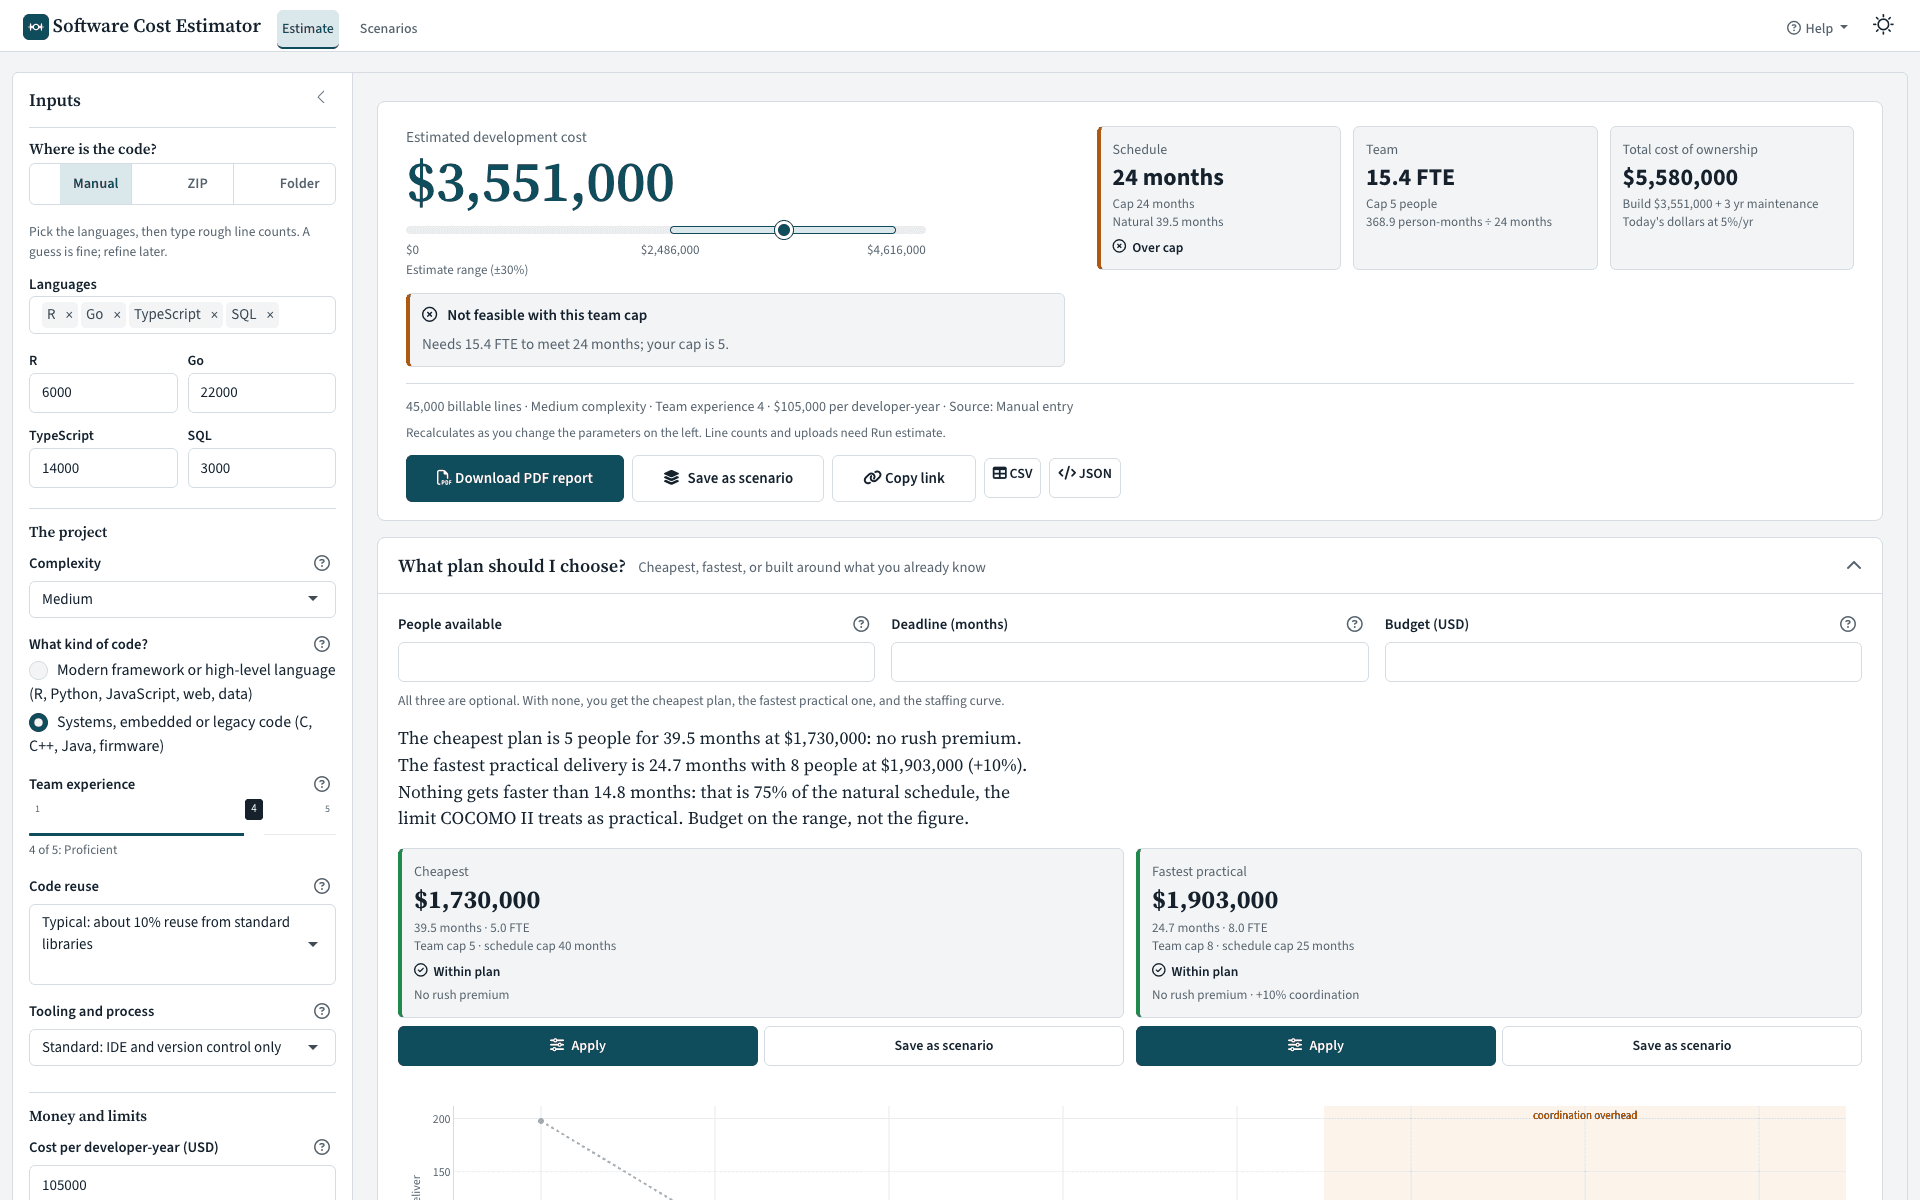
Estimating what an internal Shiny or data-science tool would cost to build commercially usually comes down to a gut number nobody can defend. Generic COCOMO calculators don't understand mixed codebases, the toolkit's own early versions only understood R, Python, SQL and JavaScript, and ad-hoc spreadsheets drift: the v1 model had a discrete schedule-compression premium ladder where moving a deadline by one month could swing the estimate by up to 42%.
Architecture
- 1.Input
- Local folder scan
- ZIP upload (50 MB)
- Manual line entry
- 2.Count & weight
- 21 languages detected
- Documented productivity weights
- Docs/config excluded
- 3.COCOMO II
- A × KLOC^B × EM
- Framework calibration: 0.85 or 1.0
- TDEV = 3.67 × E^D · ±30% range
- 4.Constraints
- Team cap (max 8)
- Smooth SCED premium
- Coordination +10%
- 5.One decomposition
- cost_steps()
- Sums to the headline
- Rounded for display
- 6.Output
- Plan advisor · waterfall · drivers
- Maintenance & TCO (NPV)
- Quarto + Typst PDF · share link
What it does
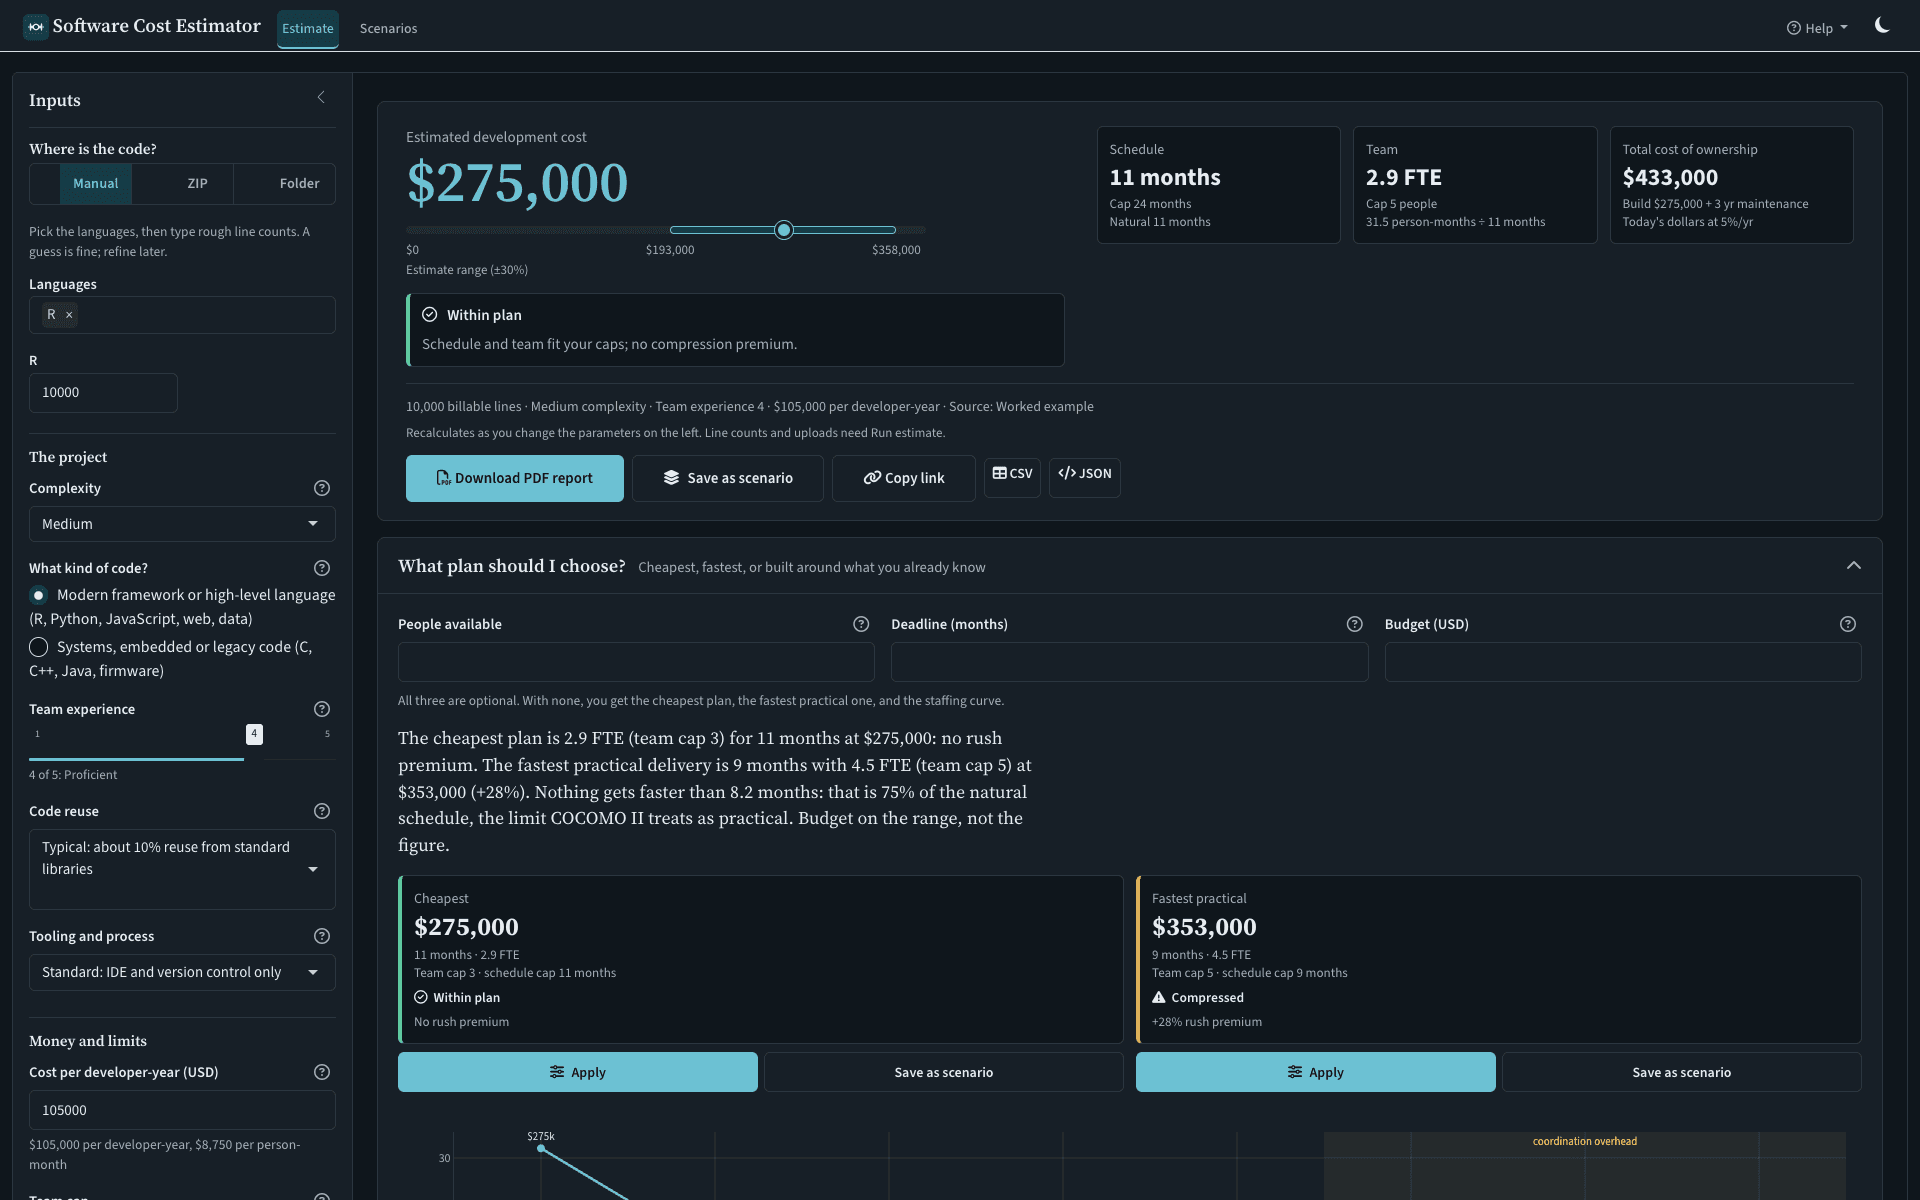
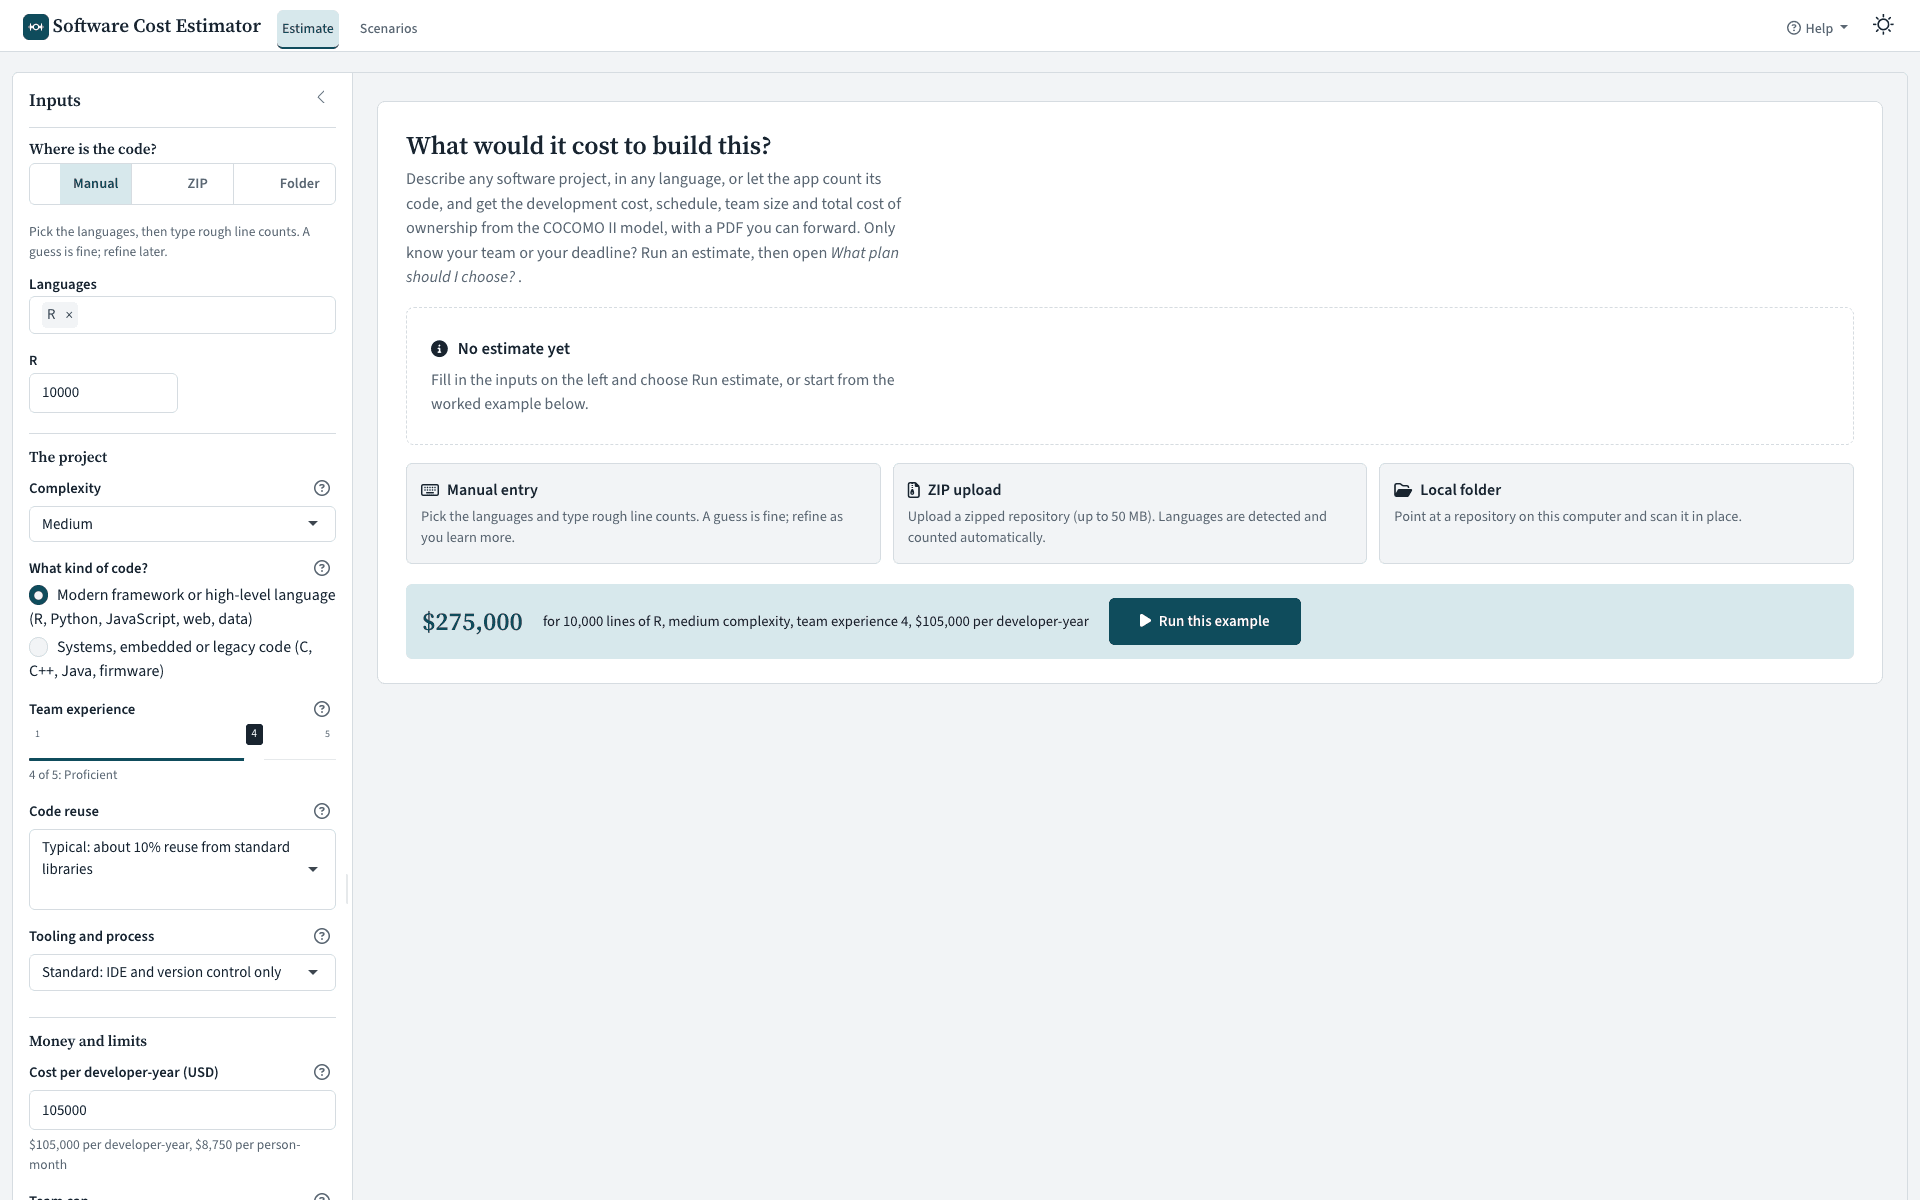
Two interfaces share one estimation engine: a Shiny app and an R CLI (analyze_repo_code()) that scans a repository and prints an scc-style report. The app is one Estimate page: inputs on the left, and on the right a headline block — the cost in a serif figure, its ±30% range drawn on a scale from $0, a status line in words (Within plan, Compressed schedule, Not feasible with this team cap), schedule and team tiles against their caps — followed by sections named for the question they answer: what plan should I choose, how the cost is built, what if the deadline moves, which choices matter most, what the code is made of, what it costs to keep running. Three code sources: pick the languages and type rough line counts, upload a ZIP (50 MB, path-traversal validated), or scan a local folder.
- Effort = A × KLOC^B × EM, with a documented 0.85 calibration applied exactly once and only when the project is declared modern-framework code
- Language productivity weighting (SQL 1.3×, JS 0.9×); docs and config (Markdown, JSON, YAML, SVG) shown but never billed
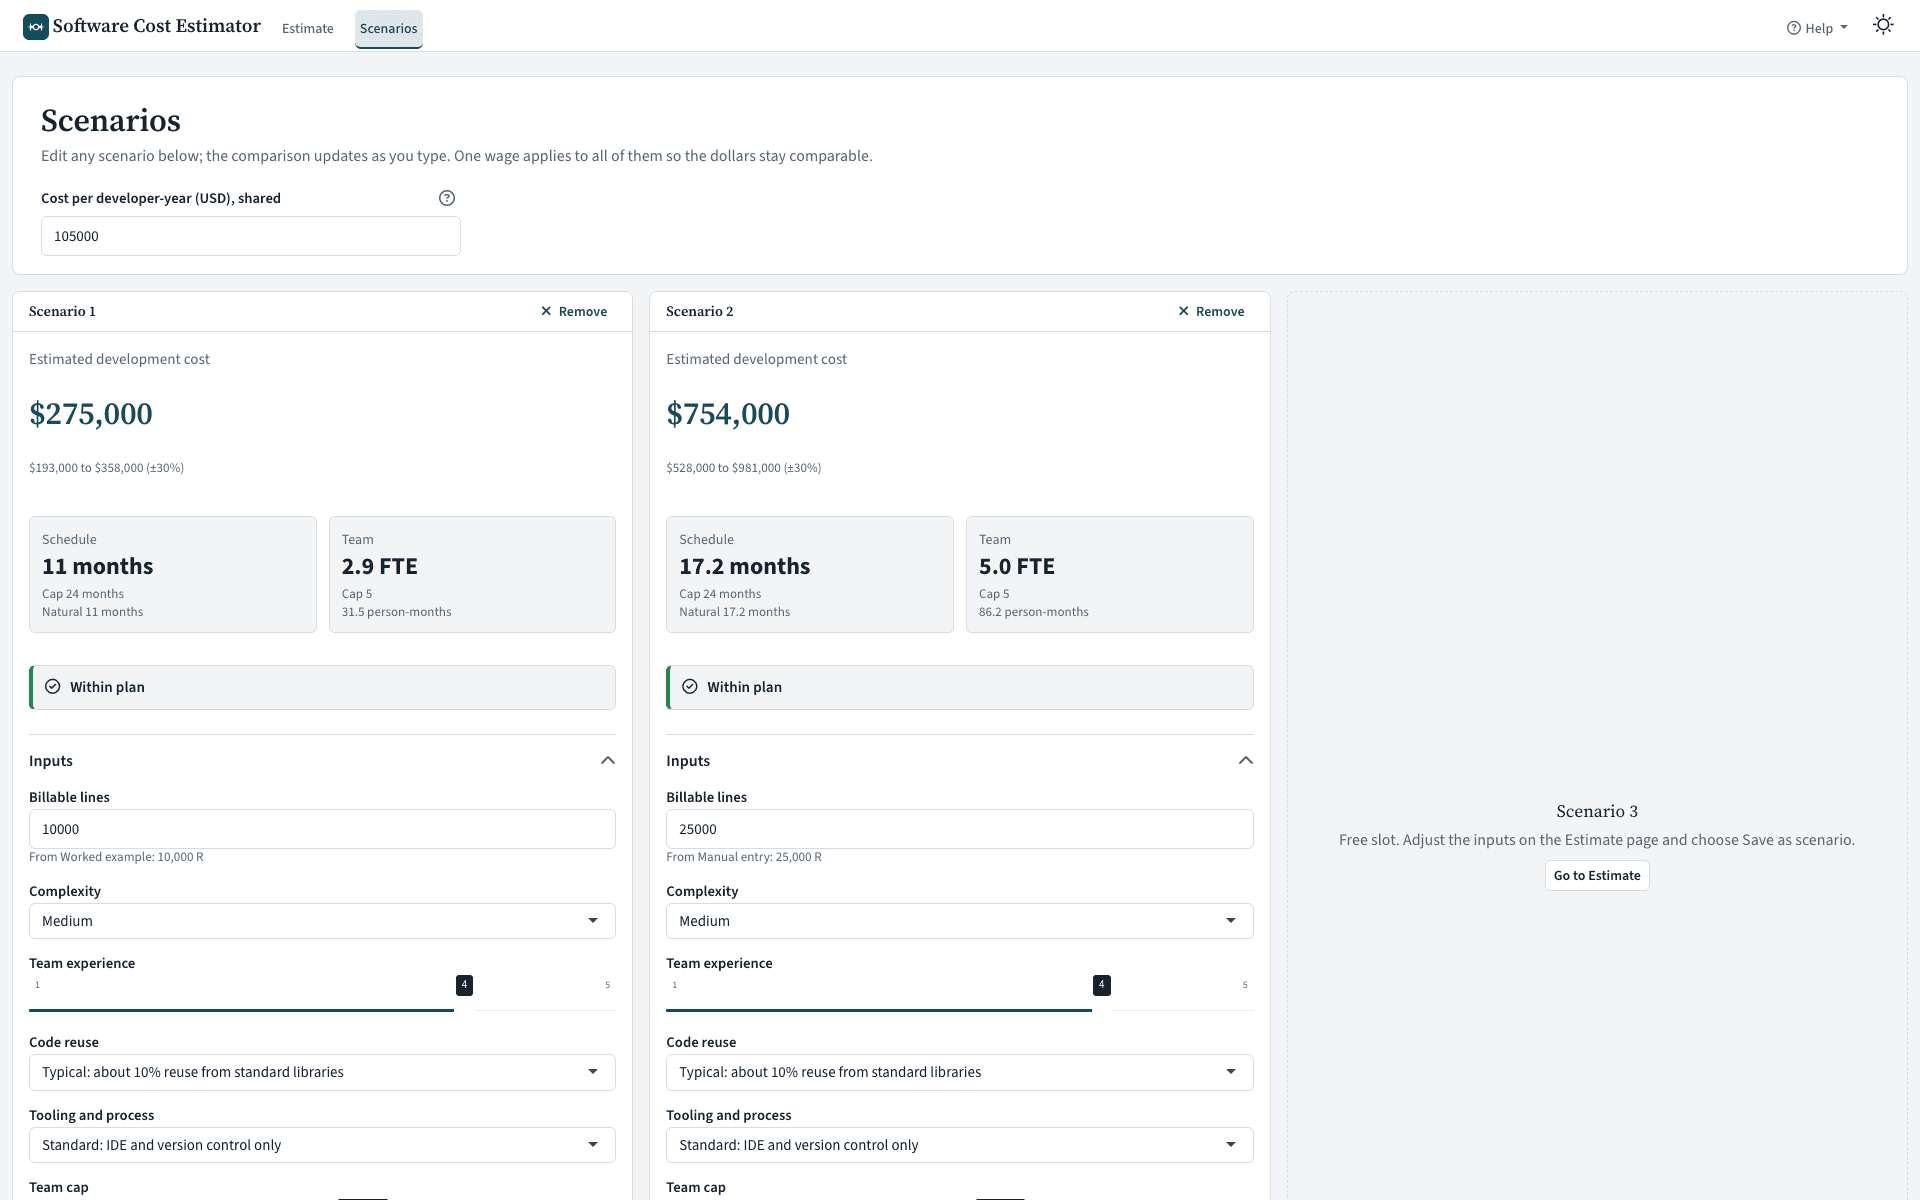
- Scenarios are saved from the estimate, editable in place, and compared on aligned bars with the cost difference against the baseline
- Line counts need a Run; every other input recalculates live, and the page says so
v2.2: any language, honest about calibration
The tool started life as the Shiny Cost Estimator and priced only R, Python, SQL and JavaScript. v2.2 makes it general without moving a single existing estimate: pick from 21 weighted languages (Go, Rust, C#, TypeScript, Kotlin, Swift, Julia and more) plus Other, and the repository scanner detects the same set. COCOMO II publishes no per-language factors, so the productivity weights are a documented heuristic, printed in the README, with unlisted languages counted at 1.0.
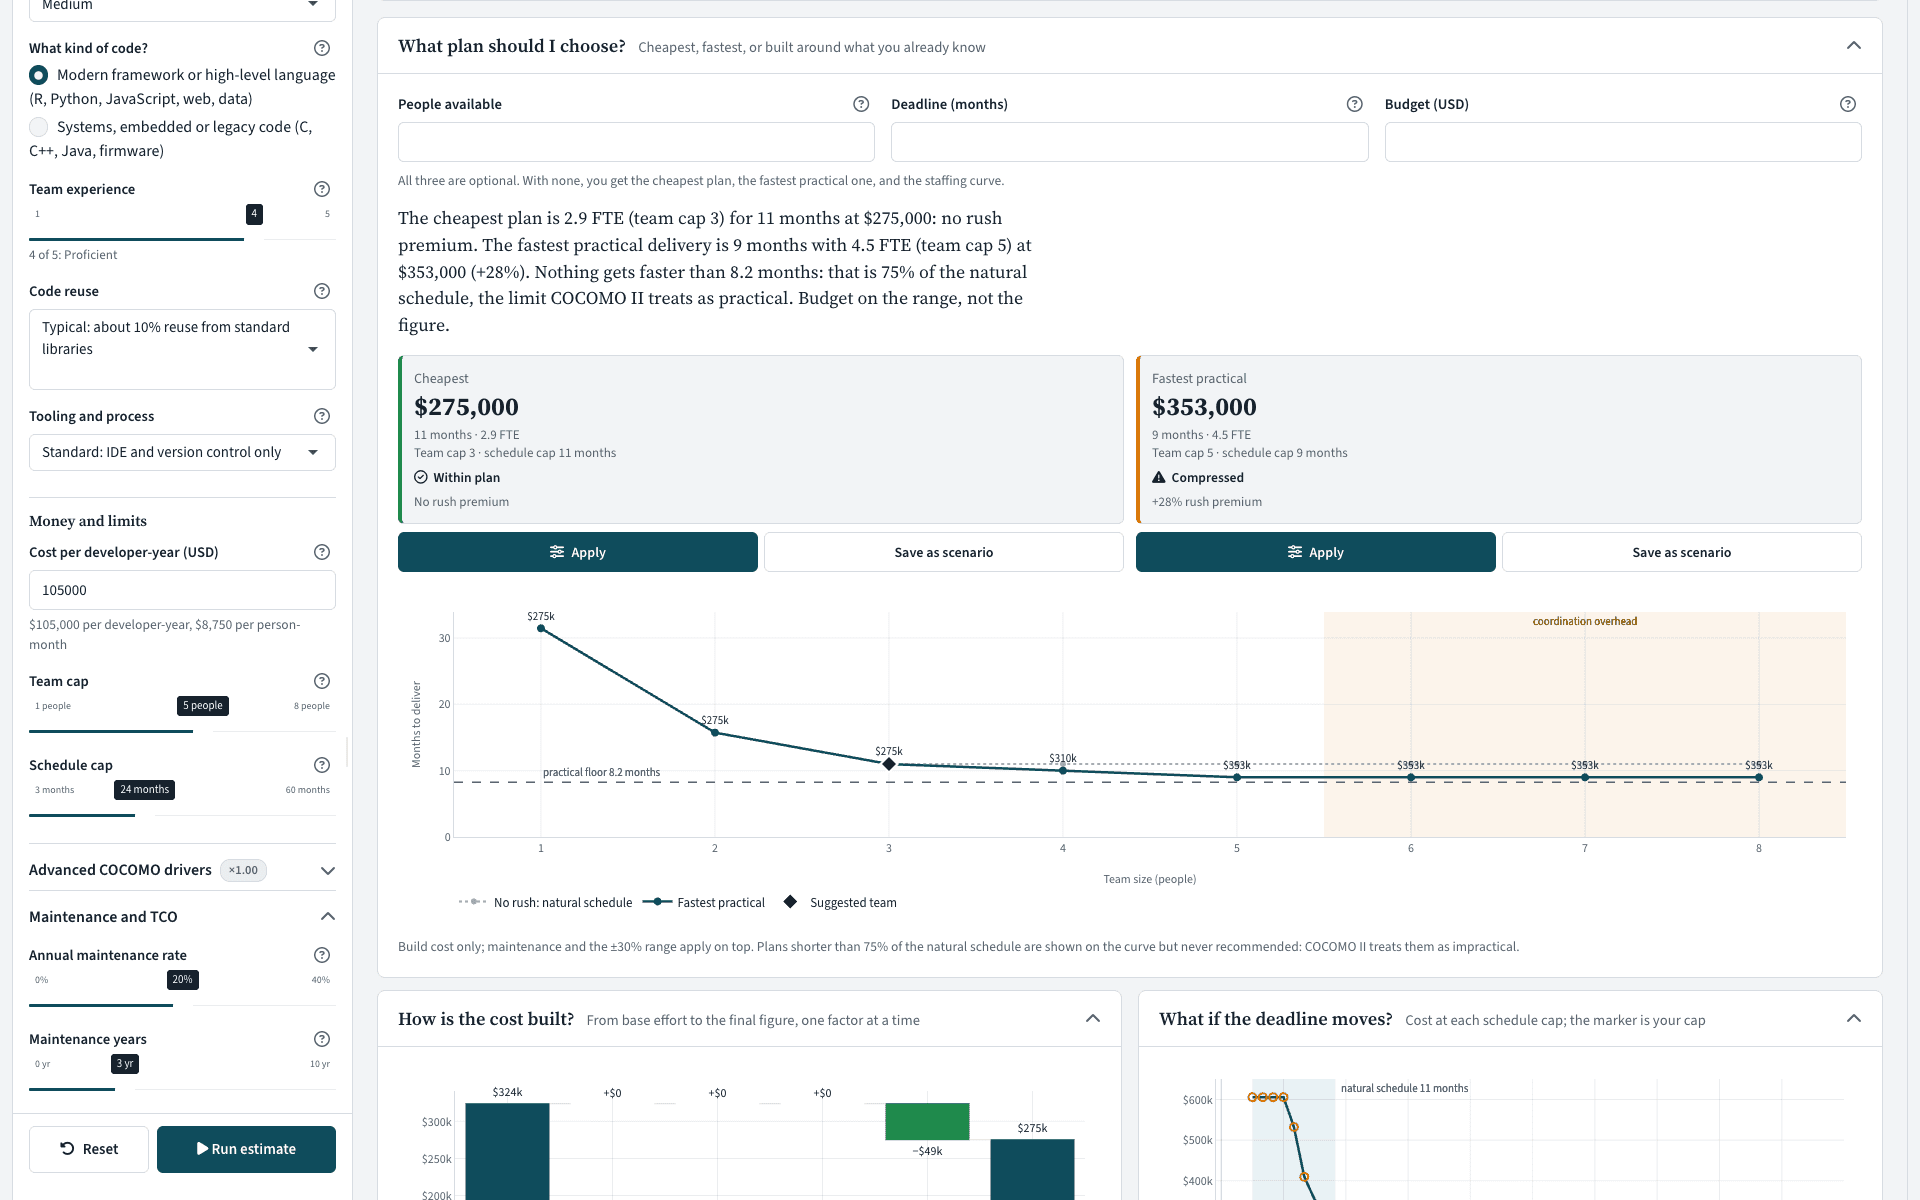
A new 'What kind of code?' choice keeps the 0.85 modern-framework calibration for high-level stacks or switches to the published COCOMO II constant for systems, embedded or legacy code. The choice is visible everywhere: the waterfall step is named Framework calibration, the PDF states it, and share links carry it (old six-language links still open).
- Benefit: one tool prices an R Shiny dashboard, a Go service or a C++ firmware module on the same published model, and says which calibration it used
- Every PDF, CSV, JSON and text report carries a version and author credit line, so a forwarded estimate can be traced to the model that produced it
What plan should I choose? A rule-based advisor
Most people do not arrive with a line count and a free hand; they arrive with a team, a deadline or a budget. The plan advisor takes any of the three, or none, and answers with the cheapest plan, the fastest practical one, and plans built around what you already know, each as a card you can apply to the estimate or save as a scenario, plus a staffing curve that shows where coordination overhead starts. No AI is involved: every card is an engine call, so the numbers agree with the headline to the dollar.
The 42% cost cliff
v1 applied schedule-compression premiums as a discrete 20/40/70/100% ladder, so moving a deadline by one month could jump the estimate by up to 42%. v2.0 replaced it with a continuous premium — ratio^1.25, anchored to COCOMO II's SCED driver and capped at 2.0× — so small input changes now produce small output changes. A regression test guards cost continuity at the schedule cap.
Model corrections, published-calibration honest
The v2.0 audit re-aligned every constant with published COCOMO II.2000 calibration: A = 2.94, C = 3.67, and the schedule exponent anchored at 0.91 — the old 1.01 anchor had been systematically shortening schedules.
- Displayed effort always equals team × schedule, including under compression
- The ±30% band is labeled an estimate range — typical COCOMO II accuracy — never a confidence interval
- Teams of 6+ carry a 10% coordination premium, and infeasible compressed plans are flagged, not silently absorbed
- Maintenance escalates 5%/yr and is reported both nominally and discounted to present value
v2.1: one number that agrees with itself
A UX review found the biggest risk was not looks but trust: the waterfall and the driver chart priced the same factor differently, the tradeoff marker floated off its own curve, the share link dropped most inputs, and TCO was present value in one place and nominal in another. v2.1 fixed the display layer without touching the engine. One cost decomposition (cost_steps()) now feeds the waterfall, the ranked drivers, the text report, the CSV and the PDF, and sums exactly to the headline. Figures are rounded for display so a ±30% estimate never reads as dollar-accurate.
- Reuse, tooling and the five COCOMO drivers became named rating levels mapped to the published multipliers, replacing 0.01-step sliders nobody could interpret
- Share links carry every input that moves the number and the address bar is always the link; a test asserts the round trip reproduces the estimate to the dollar
- Light and dark themes from one token set, self-hosted Source Sans 3 and Source Serif 4, keyboard focus rings, skip link, reduced-motion support, phone layout
- KPI tiles refuse to render without a reference and n; empty and error views must say which kind they are and why
About 300 assertions lock the math
The test suite grew from 59 assertions to 297 at v2.1 and 440 at v2.2, across 9 files, treating the estimation model as an API with a contract. v2.2 added tests that a share link reproduces the full estimate for any language mix, that old links still open, that the systems calibration removes exactly the 0.85 discount, and that the scanner bills the new languages.
- Golden-value regressions and model invariants (effort = team × schedule, exact wage linearity)
- Billable-classification tests — adding documentation never moves the estimate
- UI-contract tests, a share-link round trip to the dollar, cost_steps() summing to the headline, a testServer smoke test, and an end-to-end PDF render
- Drift detection that fails CI if the deployable modules/ copies of the engine diverge from R/
- CI quality gates beyond the tests: colours only in the theme file, no font CDN, no emoji, the version in one place, onboarding JSON in sync, and an app-start smoke test
Client-ready PDF, no LaTeX
One click renders a five-page report — cover with the headline estimate, range and status; labelled waterfall and ranked drivers; tradeoff curve and ownership over time; the cost-steps table; methodology — via Quarto + Typst, with no LaTeX and no headless Chrome, so it runs on shinyapps.io. The PDF uses the same tokens, fonts, cost steps and rounding as the screen.
- A single design-token source drives the app, every chart, and the PDF
- Shareable URLs with validated, bounds-checked parameters; CSV and JSON export
- A single-file onboarding microsite (why + guided walkthrough) ships with the app
Stack
- R
- Shiny
- bslib
- COCOMO II
- Plotly
- Quarto + Typst
- testthat