Case study. R / Shiny / LLM.
AMIRA
AI-powered manufacturing analytics platform
Internal enterprise application, built at Takeda Pharmaceutical
- Role
- Full-stack: ETL, modeling, app, RAG layer, deployment
- Status
- Productionv1.10.2~150 daily users
- Context
- Takeda LA
- Hours saved (initial est.)
- 4,000+
- Process performance gain
- ~30%
- Token reduction
- 70%
- Active users
- ~150
Initial estimate; period unstated, never annualized
Supported at a bottleneck constraint, SPC analytics
TOMO: statistics sent instead of rows
Daily users, AMIRA
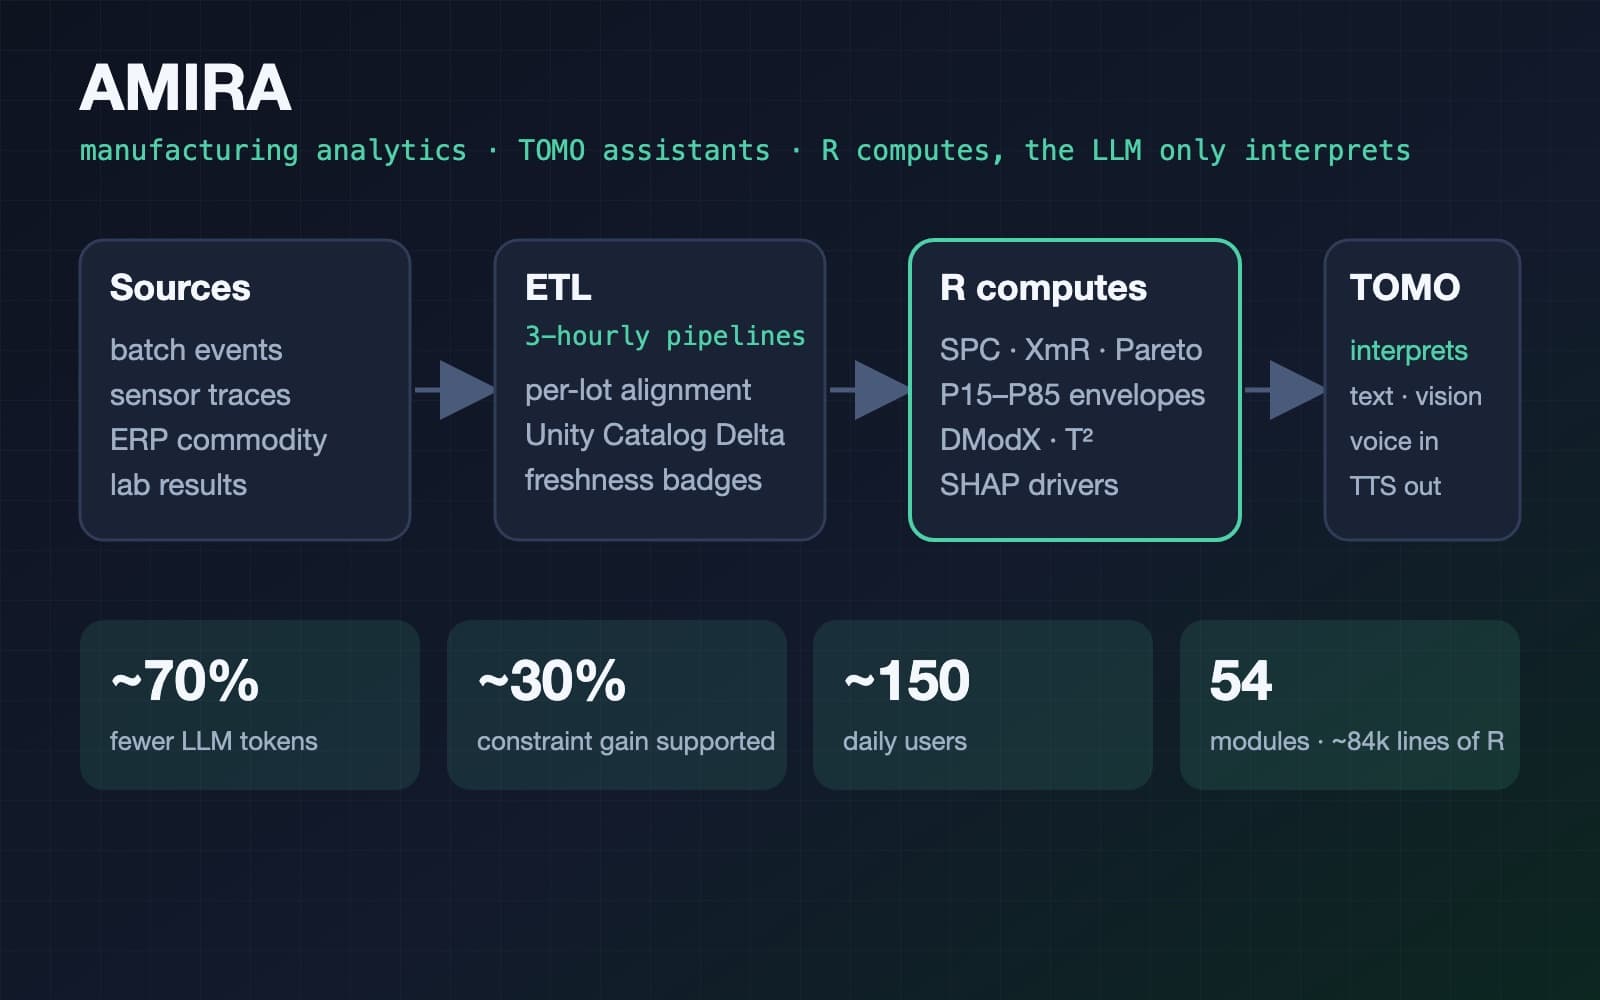
The problem
Fractionation process engineers needed near-real-time insight across FP002, FP005 and G-Cent standard work, but the data lived in disconnected systems (OSI PI sensors, JDE commodity data, LIMS) and answering a single process question meant manual pulls and spreadsheet wrangling. PowerBI dashboards showed what happened but couldn't explain why — or be trusted to quote exact numbers.
Architecture
- 1.Sources
- DeltaV batch events
- OSI PI minute traces
- JDE commodity · LIMS
- 2.ETL · 3-hourly pipelines
- Reconcile JDE vs process
- Per-lot alignment
- Unity Catalog Delta
- 3.R computes
- P15–P85 good envelopes
- DModX · T² · Q-residuals
- Trend · shift · percentiles
- 4.TOMO retrieval
- Equipment pre-filter
- Vector search
- Client-side date filter
- 5.Answer
- LLM interprets R output
- Chart-aware MVDA reading
- Voice in · TTS out
- 6.Example answer
“Flow rate on this lot ran below the P15 envelope through the end of the step. The shift test fired; the trend test did not.”
Based on
- P15–P85 envelope, computed in R
- Shift and trend tests
- Lots in the payload
- Data through this session's refresh
How it is kept honest
R computes every statistic TOMO is allowed to talk about: means, medians, percentiles, trend and shift, SPC limits and the MVDA contributions. The model receives those computed blocks, never the rows, and interprets them. It cannot produce a number it was not handed.
- Guardrails
- Equipment pre-filter before the vector search; date ranges applied client-side after it
- Multi-lot payload capped at three lots to bound token spend
- A 'Based on' evidence line under every answer
- Stop control in TOMO and TOMO Vision
- Per-session data freshness, so one user's refresh never looks current to another
- How correctness is checked
- A determinism regression asserts TOMO's R-computed blocks against seeded fixtures. The testthat suite grew from 90 to 322 blocks at v1.10.2, with ratchet lints on global assignment, silent handlers and file length. Approved through the site SDLC as a non-GxP informational tool with a 16-artifact dossier.
- Cost
- About 70% fewer tokens per call than sending rows, because the model receives statistics instead of data.
- Where it can still be wrong
- An interpretation can still be wrong: the model reads charts and text, and a misreading is caught by the reader, not by code
- Thumbs-up/down feedback and the prompt are logged to Databricks Delta so a wrong answer can be traced to its payload
- Stop control
- Long assistant runs can be stopped by the reader; elapsed time is shown, never a countdown.
Reliability and scale
- Refreshed on demand in near real time; every pipeline runs on a three-hour schedule, and data-freshness badges are per session
- AWS S3 to Databricks Unity Catalog migration behind a storage abstraction with a schema manifest that preserves R types across SQL round-trips; no downstream module changed
- 54 modules and roughly 84,000 lines of production R, with a centralized RAG helper module so retrieval logic is implemented once
- Self-hosted fonts and a responsive viewport because plant-floor networks block CDNs
- Approved through the site SDLC as a non-GxP informational tool; the 16-artifact dossier closed a platform audit finding
What it does
AMIRA — Advanced Manufacturing Insights & Real-time Analytics — is a multi-process analytics platform covering FP002, FP005 and G-Cent standard work, refreshed on demand in near real time with every pipeline on a three-hour schedule: 54 modules and roughly 84,000 lines of production R, built and maintained end to end. A Tier 2 Deep Dive dashboard identifies constraints with SPC control limits, XmR charts, Pareto views and cross-filtering; constraint analytics on the cleaning step supported a ~30% improvement at a bottleneck constraint, returning engineer and operator hours to the process. Alongside it sit standard-work analytics per process, delay reporting written back to Databricks, JDE commodity reconciliation against process data, and two assistants — TOMO for text and TOMO Vision for charts.
TOMO — the AI assistant
TOMO is a hybrid-RAG chatbot built on a discipline I use everywhere: R computes the statistics (mean, median, percentiles, trend, shift) and the LLM only interprets them. That single decision cuts token spend ~70% and gives a hard anti-hallucination guarantee — the model cannot invent a number it was never handed. TOMO pre-filters by equipment before the vector search and applies date ranges client-side afterward.
- TOMO Vision — multimodal reasoning over charts, tables and text together, with chart-aware MVDA interpretation
- Voice input (Web Speech API) for gloved operators; TTS that skips table rows so operators hear analysis, not recitations
- Thumbs-up/down feedback and last-5 recent prompts logged to Databricks Delta for one-click reuse
Process modeling
- Sensor Process Variation — OSI PI minute-resolution traces (flow rate, differential pressure, temperature, turbidity) with P15–P85 'Good' envelopes and per-lot anomaly overlays
- SIMCA-style Batch Evolution Model — DModX-over-maturity trajectories against the Good-population +3SD limit, with per-minute sensor contribution drill-downs (Hotelling's T², Q-residuals)
- Multi-lot drill-down — overlay up to 5 lots; the LLM payload is capped at 3 to bound token spend
Engineering & accessibility
A centralized RAG helper module consolidates 12 core functions — vector search, post-filtering, date parsing, R-powered summary stats and scheduling-delay enrichment — so the same logic isn't reimplemented across features. The UI ships a viridis colorblind-safe high-contrast mode (WCAG 2.1 AA), 44px+ tap targets, and data-freshness badges shared across users.
2026: models, migration, governance
- MVDA classifier + SHAP answers 'why was this lot long?' — a three-engine shootout (Random Forest, XGBoost, penalized logistic regression) with held-out metrics, a per-lot SHAP waterfall, and performance-over-time fed by an append-only prediction log
- AWS S3 → Databricks Unity Catalog migration behind a storage abstraction with a schema manifest that preserves R types across SQL round-trips — no downstream module changed
- UX 2.0: self-hosted fonts because plant-floor networks block CDNs, responsive viewport, phase-colored role cards, KPI tiles
- August 2026: a dedicated SPC engine shipped with its own tests — 90 tests across six testthat files, including a determinism regression asserting TOMO's R-computed blocks against seeded fixtures
- October 2026, v1.10.2 'Clarity & Accessibility Enhancements': KPI tiles with reference and n, honest per-session freshness (a shared timestamp had made one user's refresh look current in every other session), SPC rules 1–4 with labelled limits, colour-blind-safe palettes, dark mode for charts, Stop in TOMO and Vision, a 'Based on' evidence line under every answer, and the sidebar grouped by job with Agentic BI renamed Deep Dive; the test suite grew from 90 to 322 blocks with ratchet lints on global assignment, silent handlers and file length
- Approved through the site SDLC as a non-GxP informational tool; a 16-artifact dossier — URS, architecture, test plan and scripts, traceability matrix, runbook, AI-governance statement — closed a platform audit finding
Stack
- R Shiny
- Databricks Foundation Models
- Databricks Unity Catalog
- OSI PI
- Hybrid RAG
- SHAP
- Posit Connect