Case study. R / Shiny / RAG.
BioTrack
Bioburden investigation platform with a deterministic hypothesis engine
Internal enterprise application, built at Takeda Pharmaceutical
- Role
- Full-stack: data aggregation, analytics, rule engine, RAG, app
- Status
- Productionv1.2.1October 2026
- Context
- Takeda LA
- Hours saved, aggregation (initial est.)
- 450+
- Deterministic rules
- 9
- LLM-invented hypotheses
- 0
- Regression assertions, 0 failing
- 1,065
Initial estimate, data aggregation only
Arithmetic on data already on screen
By contract: narration restates fired rules only
v1.2.1, October 2026, up from 215
The problem
A single bioburden deviation could take hours to assemble: pulling and reconciling process, environmental-monitoring and lab data by hand before any analysis could start — time that ate into the 30-day window reserved for physical inspection, CAPA design and QA review. The harder problem came second. An investigation aid that guesses is worse than no aid at all, because a plausible wrong cause is expensive to disprove and easy to believe.
Architecture
- 1.Sources
- DeltaV · MODA · Labware
- ERP maintenance (JDE)
- Live quality system
- 2.R computes
- Lot vs its own limits
- Base rates
- Comparison correction
- 3.Rule engine
- 9 arithmetic rules
- Fired · did not fire
- Could not run
- 4.Evidence panel
- Lot map · lot record
- Labelled maintenance claims
- Four kinds of nothing
- 5.Narration
- Restates fired rules only
- Cannot add or rank
- Zero fired is a result
- 6.Example narration
“Two rules fired for this lot: the result exceeded the lot's own limit, and the previous lot on the same equipment carries a linked quality record. The other rules did not fire. Maintenance proximity corroborates; it does not add a finding.”
Based on
- 9 rules, computed in R
- Records in scope and window
- Retrieved sources
- Model and data-through
How it is kept honest
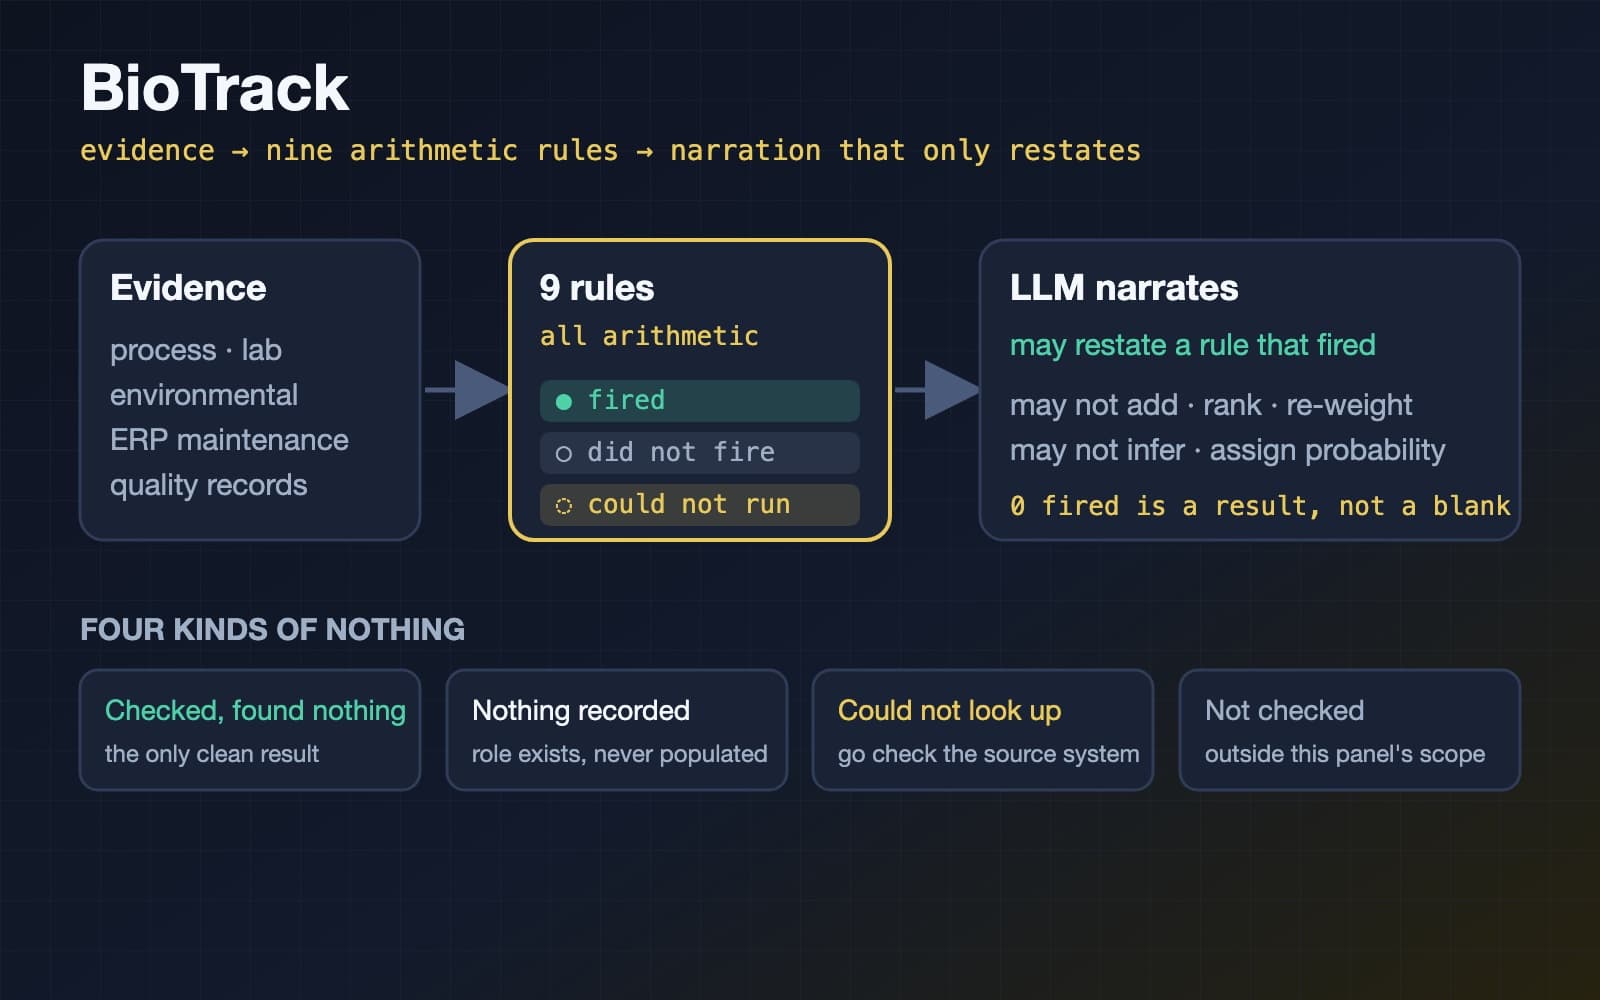
Nine deterministic rules, each arithmetic on data already on screen, compute every finding. Each reports one of three states: fired, did not fire, could not run. The language model may restate a rule that already fired. It may not add, rank, re-weight, infer or assign a probability.
- Guardrails
- Three-state rule contract: fired, did not fire, could not run; 'no data' and 'no signal' are never collapsed
- Evidence weight lives in R, not in the model's rubric (v1.2.1)
- Maintenance proximity can corroborate a fired rule, never trigger one; absence is never presented as reassuring
- Every flagged rate corrects for the number of comparisons; small denominators use a Wilson bound
- An evidence line (records in scope, window, retrieved sources, model, data-through) under every answer and in every export
- How correctness is checked
- A regression suite that needs no test framework, runs against a frozen clock and is versioned with the app asserts the three-state contract and the exact wording investigators see. It grew from 215 assertions at v1.2.0 to 1,065 at v1.2.1 with none failing. Alert-rate definitions were consolidated into one tested function at about 40 call sites with a hand-checked golden test.
- Where it can still be wrong
- Zero fired rules is reported as a result, not an empty table, so a clean lot is not mistaken for a failed lookup
- An empty maintenance panel is labelled as one of four kinds of nothing: checked and found nothing, nothing recorded, could not look it up, not checked
- A record-matching defect found in v1.2.0 was fixed and disclosed in-app, with an instruction to re-run affected queries
- The regression suite is not yet run by CI on every push
Reliability and scale
- Reads the quality system live rather than from a hand-captured snapshot, so the context is whatever is true now
- 16 modules and roughly 20,800 lines of R at v1.2.0; shares DevSight's vector index for a search scoped to bioburden investigations
- Honest controls: a filter that did nothing and a countdown that was not real were replaced in v1.2.1
- An anonymous feedback tab and a single-file onboarding microsite ship with the app
What it does
BioTrack is the site's manufacturing GenAI platform for microbial (bioburden) investigations. It pulls process, environmental-monitoring, lab, ERP-maintenance and quality-system data into a single per-lot record, so an investigator starts from assembled evidence instead of a week of data plumbing — protecting the 30-day closure window for the work that actually needs human judgment.
It began as a fork of the retrieval architecture DevSight had reached at v2.5.0. v1.2.0 adds a third tab, Lot Context, alongside the analytics and assistant views.
Lot Context
The tab opens on a map of recent production lots carrying four encodings at once: colour is the result, size is the magnitude, a ring marks a lot with a linked quality record, and an arrow points to the next lot run on the same equipment. The point is to make sequence visible — most of what investigators ask is really a question about what ran before. Clicking a lot opens its full record:
- The result read against that lot's own limits, not a site-wide average
- The full equipment chain it passed through, with cycle times
- A process timeline pulled from the control system
- Maintenance history for the equipment involved
- Similar lots, linked investigations, and the leads those suggest
Nine rules, all arithmetic
The hypothesis engine is nine deterministic rules. Every one is arithmetic on data already on screen — a comparison, a count, a ratio — and every one reports in three states: it fired, it did not fire, or it could not run because the inputs weren't there. The third state matters as much as the first. 'No data' and 'no signal' are different answers and the panel never collapses them.
The LLM narrates and nothing else. It may restate a rule that already fired, in plain language. It may not add a hypothesis, rank hypotheses, re-weight them, infer a new one, or attach a probability to any of them. When zero rules fire, that is rendered as a result — nine rules ran, none fired — instead of an empty panel that leaves the investigator guessing whether the tool broke or the lot is clean.
- R computes the rates, cycle-time correlations, recovery frequencies and risk scores; the model only ever sees the output
- Six Plotly chart types generated per analysis — equipment heatmaps, scatter, trend lines, risk matrices
- Retrieval over the quality system cites only record identifiers present in the loaded data
Maintenance evidence from the ERP
Maintenance records come from JD Edwards, and v1.2.0 stopped treating them as one undifferentiated pile. Three claims are labelled separately because they are not equally strong. Routine scheduled work folds away by default, so what sits on top of the panel is the work that was unusual.
- Work performed on the equipment itself — the direct claim
- Work performed in the room the equipment sits in — proximity, not contact
- Work performed in the adjacent service space — weaker still, but not nothing
Four kinds of nothing
An empty maintenance panel used to mean four completely different things and the investigator had no way to tell which — so a blank panel could be read as reassurance when it was actually a failed lookup. v1.2.0 labels them apart:
- Checked, and found nothing — the only genuinely clean result
- Nothing recorded for this role — the record type exists but was never populated here
- Could not look it up — the query failed or the identifier didn't resolve
- Not checked — outside what this panel queries at all
The flag that got measured, then deleted
A 'recent maintenance' flag was proposed as a signal: highlight lots where work had happened on the equipment shortly beforehand. Before building it, we measured its base rate against the record set. Recent maintenance turned out to be present in a majority of records. The flag would have fired on most lots most of the time — useless as a discriminator, and worse than useless as a prompt, because it looks like evidence.
So it was deleted and rebuilt with a different job. Maintenance proximity is now corroboration: it can strengthen a conclusion a rule already reached, but it can never trigger one. The inverse is enforced too — absence of recent maintenance is never presented as reassuring, because a base rate that high makes absence almost as uninformative as presence.
Reporting a null as a finding
The equipment × failure-category view flags elevated rates. Run naively, that view makes a large number of comparisons at once and will hand back elevated cells purely by chance — the standard way a dashboard manufactures a lead that doesn't exist. Every flag now corrects for the number of comparisons being made, and rates on small denominators use a Wilson bound rather than a raw proportion, so a two-out-of-three doesn't outrank a much larger sample.
After correction, nothing is flagged. That result is shown to users in words — the units are running statistically indistinguishable profiles — rather than left as an empty table. A null users can see is a decision they can act on. A null they can't see just looks like the feature is broken.
Live quality-system integration
The assistant's quality context used to come from a hand-captured snapshot of under two dozen records — enough to demonstrate the idea, not enough to investigate with. v1.2.0 reads the quality system directly, so the context is whatever is true now instead of whatever was true the day the snapshot was taken.
Building it surfaced a record-matching defect in the old behaviour: some records had been matched to the wrong lot. That was fixed and disclosed in-app, with an explicit instruction to re-run any query that had relied on the old matching. Correcting it silently would have left investigators holding conclusions they had no reason to re-examine.
Where it stands
BioTrack shipped v1.2.0 in August 2026 as the site's manufacturing GenAI platform for microbial investigations, growing from roughly 12,900 to roughly 20,800 lines of R across 16 modules over that cycle. The weeks after release went to the unglamorous part: an 11-file, 215-assertion regression suite that needs no test framework, runs against a frozen clock, and is versioned with the app — it asserts the three-state rule contract and the exact wording investigators see, so the containment contract can't erode silently. An anonymous feedback tab and a single-file onboarding microsite shipped alongside it.
v1.2.1, the transparency release (October 2026), fixed what a September audit called misstatements rather than polish: twelve alert-rate definitions became one tested function at about 40 call sites with a hand-checked golden test and a Wilson interval on every rate; a filter that did nothing and a countdown that was not real were replaced with honest controls; evidence weight moved out of the language-model rubric into R; and an evidence line (records in scope, window, retrieved sources, model, data-through) now sits under every AI answer and in every export. The suite went from 215 assertions to 1,065 with none failing. What it still doesn't have is CI running that suite on every push.
It also shares DevSight's vector index for a search scoped to bioburden investigations; the general-purpose deviation search moved into the Horizon proof of concept (v1.2.0). Retiring an application and retiring a capability are different decisions, and only the first one was made.
Stack
- R Shiny
- Databricks Foundation Models
- Databricks Vector Search
- Hybrid RAG
- JD Edwards (ERP)
- Plotly